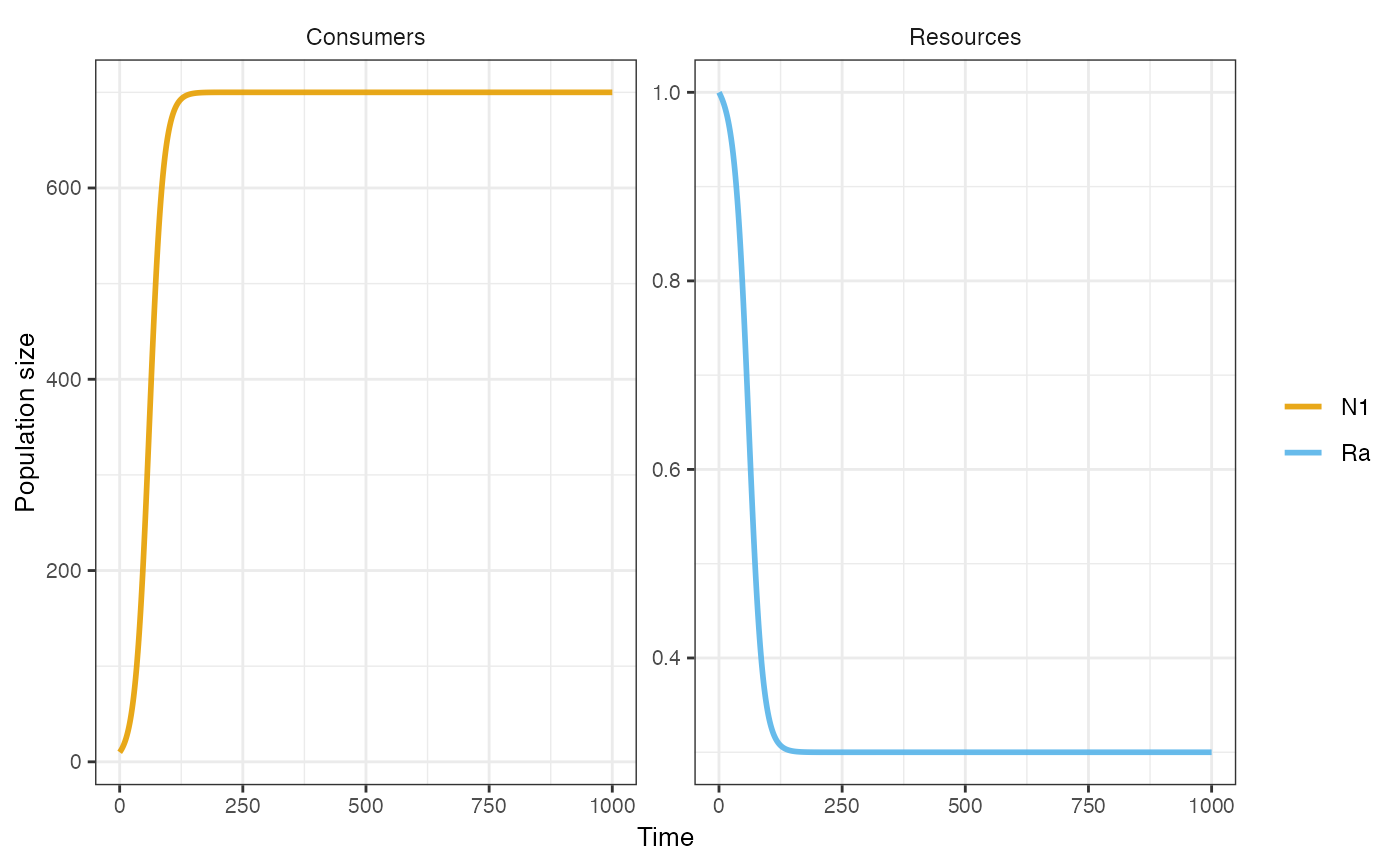
Plot consumer and resource dynamics from deSolve output
plot_rescomp(
  model,
  consumers = TRUE,
  resources = TRUE,
  logy = FALSE,
  lwd = 1,
  xlims = NULL
)
Arguments
- model
List output from
sim_rescomp(). First element is an object of class deSolve. Second element is an object of class rescomp.- consumers
Plot consumer dynamics? Default = TRUE.
- resources
Plot resource dynamics? Default = TRUE.
- logy
Log transfrom y-axis (default = FALSE).
- lwd
Line width (default = 1)
- xlims
Vector of length giving the time frame to plot.
Value
ggplot object
Examples
pars <- spec_rescomp()
m1 <- sim_rescomp(pars)
plot_rescomp(m1)